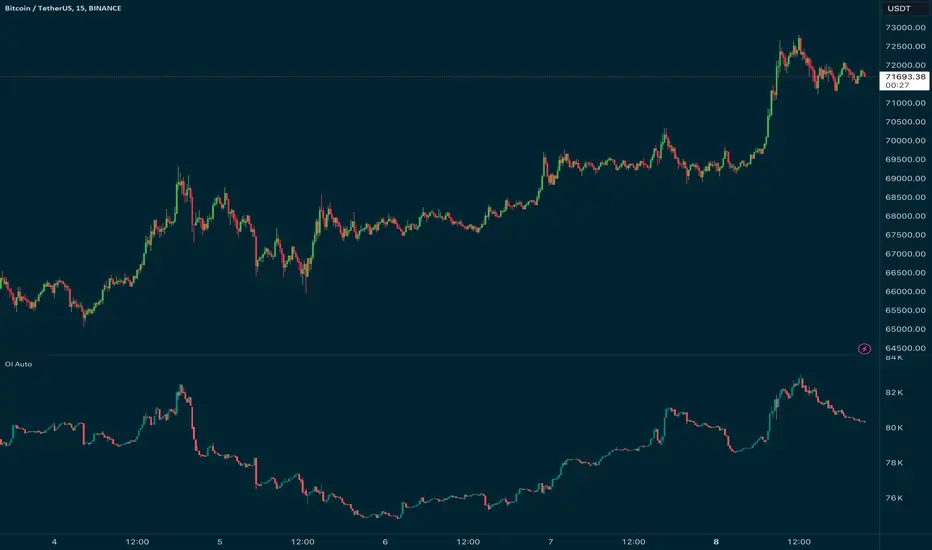
Open Interest Auto OverrideWhat does this “Open Interest Auto Override” Indicator
do?
Open Interest data is not supplied by every exchange to TradingView, however it is available on Binance Perpetual Futures. This script helps the crypto trader to identify the equivalent Binance Perpetual Futures Chart that has Open Interest Data available and automatically displays this on the traders chart.
How can a trader use this indicator?
This helps the trader to identify if there is Open Interest Data available in Binance and automatically displays it, making it easier to switch Coins whilst viewing the market.
What is Open Interest and how can I trade using this indicator?
Open Interest (OI) is the number of open futures contracts held by traders in active positions. The higher the value the Higher the number of open positions which indicates an increase in interest by traders in the asset.
If OI is increasing an equal number of longs and short positions are being opened.
If OI Decreases both longs and shorts are exiting the market.
If OI remains unchanged, no new contracts are entering or exiting, or an equal number of positions are being opened as there are being closed.
Open Interest can help traders by giving us a hint that a breakout may occur. If Open Interest is increasing whilst price is consolidating it may indicate that a breakout is imminent. If Open Interest is decreasing whilst price is consolidating it is likely that a false move in the form of a stop hunt may be issued prior to the actual breakout.
Usage of the Indicator:
By default the indicator will automatically use the Equivalent Binance Perpetual Chart for the Data
You can override the symbol manually if you what to view another exchanges data.
"open interest" için komut dosyalarını ara
Open Interest SThis script shows Open Interest. You can choose measure, view and highlight large OI changes based on Z-Score.
Features
Measure USD or COIN
View OI Candles or OI Change columns with wicks
Z-Score Highlight Z Length is the period for calculations, Z Threshold is the standard
deviation from the average change in OI for the selected period
Color You can change the colors for OI
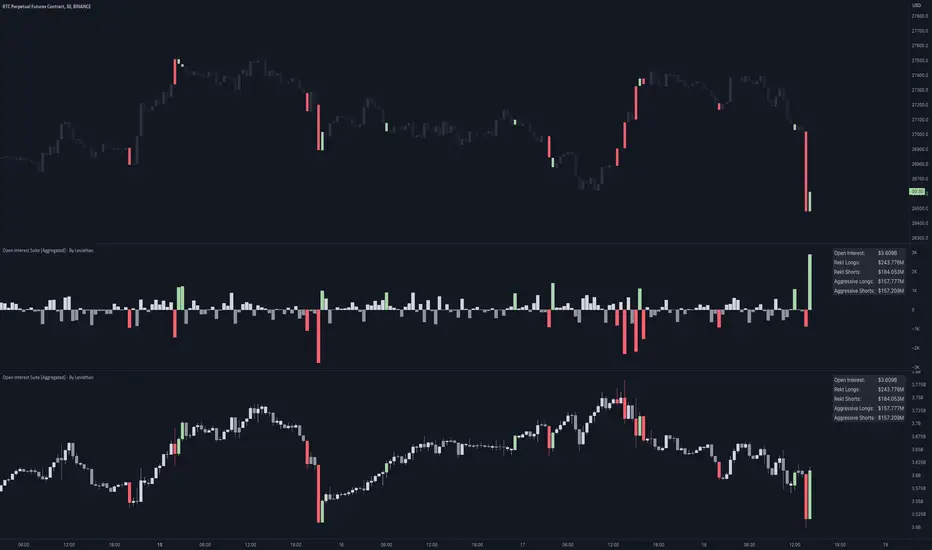
Open Interest Suite [Aggregated] - By LeviathanThis script is an all-in-one indicator that uses aggregated Open Interest data to plot OI candles, Open Interest Delta, OI x rVOL, and OI RSI. It also includes tools such as an OI Distribution profile, large OI increase/decrease coloring, a Stats Screener, and much more.
You can select and have the script plot the following:
- Open Interest in the form of OHLC candles
- Open Interest Delta in the form of a histogram
- Open Interest x Relative Volume in the form of a histogram
- Open Interest RSI in the form of a line
Additional features include:
- OI Distribution Profile (It shows the distribution of open interest in the visible range on y axis. This makes it easier to identify when Open Interest is relatively high or low and at which values most of the action took place)
- Stats screener (The screener includes the real-time net Open Interest value, Rekt Longs/Rekt Shorts based on large OI decreases and Aggressive Longs/Shorts based on large OI increases)
- Coloring (You can color OI Delta nodes, background and chart candles based on large OI increases/decreases)
- more
Instructions for the settings will be provided in the tooltips shortly.
Full credit goes to @KioseffTrading for the profile generation code.
Open Interest Profile (OI)- By LeviathanThis script implements the concept of Open Interest Profile, which can help you analyze the activity of traders and identify the price levels where they are opening/closing their positions. This data can serve as a confluence for finding the areas of support and resistance , targets and placing stop losses. OI profiles can be viewed in the ranges of days, weeks, months, Tokyo sessions, London sessions and New York sessions.
A short introduction to Open Interest
Open Interest is a metric that measures the total amount of open derivatives contracts in a specific market at a given time. A valid contract is formed by both a buyer who opens a long position and a seller who opens a short position. This means that OI represents the total value of all open longs and all open shorts, divided by two. For example, if Open Interest is showing a value of $1B, it means that there is $1B worth of long and $1B worth of short contracts currently open/unsettled in a given market.
OI increasing = new long and short contracts are entering the market
OI decreasing = long and short contracts are exiting the market
OI unchanged = the net amount of positions remains the same (no new entries/exits or just a transfer of contracts occurring)
About this indicator
*This script is basically a modified version of my previous "Market Sessions and Volume Profile by @LeviathanCapital" indicator but this time, profiles are generated from Tradingview Open Interest data instead of volume (+ some other changes).
The usual representation of OI shows Open Interest value and its change based on time (for a particular day, time frame or each given candle). This indicator takes the data and plots it in a way where you can see the OI activity (change in OI) based on price levels. To put it simply, instead of observing WHEN (time) positions are entering/exiting the market, you can now see WHERE (price) positions are entering/exiting the market. This is the same concept as when it comes to Volume and Volume profile and therefore, similar strategies and ways of understanding the given data can be applied here. You can even combine the two to gain an edge (eg. high OI increase + Volume Profile showing dominant market selling = possible aggressive shorts taking place)
Green nodes = OI increase
Red nodes = OI decrease
A cluster of large green nodes can be used for support and resistance levels (*trapped traders theory) or targets (lots of liquidations and stop losses above/below), OI Profile gaps can present an objective for the price to fill them (liquidity gaps, imbalances, inefficiencies, etc), and more.
Indicator settings
1. Session/Lookback - Choose the range from where the OI Profile will be generated
2. OI Profile Mode - Mode 1 (shows only OI increase), Mode 2 (shows both OI increase and decrease), Mode 3 (shows OI decrease on left side and OI increase on the right side).
3. Show OI Value Area - Shows the area where most OI activity took place (useful as a range or S/R level )
4. Show Session Box - Shows the box around chosen sessions/lookback
5. Show Profile - Show/hide OI Profile
6. Show Current Session - Show/hide the ongoing session
7. Show Session Labels - Show/hide the text labels for each session
8. Resolution - The higher the value, the more refined a profile is, but fewer profiles are shown on the chart
9. OI Value Area % - Choose the percentage of VA (same as in Volume Profile's VA)
10. Smooth OI Data - Useful for assets that have very large spikes in OI over large bars, helps create better profiles
11. OI Increase - Pick the color of OI increase nodes in the profile
12. OI Decrease - Pick the color of OI decrease nodes in the profile
13. Value Area Box - Pick the color of the Value Area Box
14. Session Box Thickness - Pick the thickness of the lines surrounding the chosen sessions
Advice
The indicator calculates the profile based on candles - the more candles you can show, the better profile will be formed. This means that it's best to view most sessions on timeframes like 15min or lower. The only exception is the Monthly profile, where timeframes above 15min should be used. Just take a few minutes and switch between timeframes and sessions and you will figure out the optimal settings.
This is the first version of Open Interest Profile script so please understand that it will be improved in future updates.
Thank you for your support.
** Some profile generation elements are inspired by @LonesomeTheBlue's volume profile script

Open Interest Bubbles [BackQuant]Open Interest Bubbles
A visual OI positioning overlay that aggregates futures open interest across major venues, normalizes it into a consistent “signal strength” scale, then plots extreme events as bubbles, labels, and optional horizontal levels directly on price.
What this is for
Open interest is one of the cleanest ways to track when positioning is building, unwinding, or aggressively shifting. The problem is raw OI is noisy, exchange-specific, and hard to compare across time. This script solves that by:
- Aggregating OI across multiple exchanges.
- Letting you choose what “OI signal” you care about (raw, delta, percent versions).
- Normalizing the signal so “big events” are easy to spot.
- Plotting those events as bubbles and levels at the exact price they occurred.
You end up with a clean, fast visual map of where large positioning changes occurred, and where those events may later matter as reaction points.
────────────────────────────────────────────────────────────
Plotting types (what you can display)
Bubbles
This mode plots OI events as size-bucketed circles on the chart. Bigger bubbles represent stronger normalized events. You can tune:
- Bubble sizing by bucket (Tiny → Huge).
- Heatmap vs solid color styling.
- Signed vs unsigned coloring (positive/negative separation or magnitude-only).
Best use:
- Spotting “where something changed” at a glance.
- Identifying clusters of positioning events around key price zones.
- Seeing whether the market is repeatedly building/closing positions at similar levels.
Levels
Levels mode draws a horizontal line at the anchor price when an extreme OI event triggers. These act like “positioning memory” levels:
- They do not claim to be support/resistance by themselves.
- They highlight prices where the derivatives market clearly did something meaningful.
Best use:
- Marking potential reaction zones.
- Combining with your price action tools (structure, OBs, FVGs) to confirm whether an OI level aligns with a technical level.
- Building a “map” of where leverage likely entered or exited.
Modes available in the script:
- Off
- Bubbles
- Bubbles + Labels
- Labels Only
- Levels + Labels
────────────────────────────────────────────────────────────
Aggregated Open Interest source (multi-exchange)
This indicator builds a single aggregated OI series by requesting OI data from multiple exchanges and summing it. You can toggle exchanges on/off:
- Binance, Bybit, OKX, Bitget, Kraken, HTX, Deribit
You can also choose OI units:
- COIN , OI in base units (native sizing)
- USD , converted for a dollar-value representation
Important note:
Not every symbol has OI data on every venue. If the script cannot build an aggregated series for the symbol, it will throw an error rather than quietly plotting garbage.
────────────────────────────────────────────────────────────
OI Source, what the bubbles are measuring
You control what “signal” is normalized and plotted:
- Delta , change in aggregated OI from the prior bar.
Use when you want to highlight bursts of new positioning or sudden unwind events.
- Raw OI , the aggregated open interest level itself.
Use when you want to highlight absolute positioning build-up periods.
- Delta % , percent change in OI.
Use when you want moves normalized to the current OI regime, useful across different market eras.
- Raw OI % , percent change form of the raw series.
Use when you want relative changes rather than absolute size.
Practical guidance:
- Delta modes are best for “event detection”.
- Raw modes are better for “regime context” and whether positioning is structurally rising or fading.
────────────────────────────────────────────────────────────
Normalization (the key to making it readable)
Because OI varies massively across assets and time, the script includes multiple normalization modes to convert your chosen OI source into a comparable “strength” value.
Options:
- ZScore , deviation from a rolling mean in standard deviation units.
- StdNorm , scaled by rolling standard deviation.
- AbsZScore , absolute value version for magnitude-only mapping.
- AbsStdNorm , absolute value version for magnitude-only mapping.
- None , plots raw values (advanced users only, often too noisy visually).
Why this matters:
Normalization makes a “1.5” or “3.0” threshold mean something across different assets and timeframes, instead of being stuck to raw OI units.
────────────────────────────────────────────────────────────
Threshold system (when bubbles/levels trigger)
The plot is driven by two user thresholds:
- Base Threshold
Controls where “meaningful” events start. Raising this reduces noise and focuses on larger deviations.
- Extreme Threshold
Controls what qualifies as a top-tier event. Extreme events are what you typically want to convert into labels and levels.
You also control side filtering:
- Both , show positive and negative events.
- Positive Only , show only increases (or positive signal side depending on source).
- Negative Only , show only decreases (or negative signal side).
In practice:
- Use Base Threshold to tune chart cleanliness.
- Use Extreme Threshold to mark only the “big stuff” that tends to matter later.
────────────────────────────────────────────────────────────
Anchor Source (where the bubble/level is placed)
The indicator places bubbles, labels, and levels at a price anchor you choose:
- HL2, Close, Open, High, Low, VWAP
This is important because “where you pin the event” changes how it reads:
- Close is clean and consistent for backtesting and candle-close logic.
- High/Low can better represent where the fight occurred intrabar.
- VWAP can be useful for “fair price” anchoring in active markets.
────────────────────────────────────────────────────────────
Style system (theme, palette, signed logic)
This script is built to look good and stay readable on busy charts.
Themes
- BackQuant, Classic, Ice, Fire, Mono, Custom
Palette Mode
- Solid , one consistent color
- Heatmap , intensity increases with magnitude
- Single Color Adaptive , adapts to chart background for clarity
Side Coloring
- Signed , positive and negative events can use different ramps
- Unsigned , magnitude-only coloring
Negative theme handling:
- Auto (mirrors your chosen theme),
- Invert (flips the ramp),
- Custom (fully user-defined negative palette).
What this gives you:
- You can run a clean “mono” look for professional charts.
- Or a high-contrast heatmap for fast scanning.
- Or fully custom branding colors for BackQuant-style presentation.
────────────────────────────────────────────────────────────
Labels (what’s inside the label)
When labels are enabled, the script can display:
- OI , the aggregated OI value
- OI + Norm , OI plus normalized strength
- Norm Only , just the normalized strength
- Src + Norm , the selected source value (Delta, Raw, %) plus normalized strength
You can also control:
- Left/Center/Right label alignment
- Number formatting style (Raw, Compact, Volume format)
Best practice:
- Use “Src + Norm” when you want both the raw event size and its rarity.
- Use “Norm Only” when you want a clean, minimal chart.
────────────────────────────────────────────────────────────
Levels and object limits (performance and cleanliness)
Because this script draws objects, it includes a hard cleanup system:
- You set Max Levels / Labels to control chart clutter.
- The script deletes older lines/labels when the limit is exceeded.
This is critical if you trade lower timeframes, where OI events can trigger frequently.
────────────────────────────────────────────────────────────
How to interpret the signals
What a large bubble usually means:
- A statistically large positioning change relative to recent history.
- This can represent fresh leverage entering, forced liquidations, or aggressive de-risking, depending on direction and context.
How to use levels:
- Treat them as “attention levels”, not automatic entries.
- Combine them with structure and liquidity tools:
- If price revisits an OI level and shows rejection, it often confirms that level mattered.
- If price slices through with no reaction, it often indicates the OI event was transitional, not defended.
Common setups:
- Clustered extreme bubbles near a breakout zone, then retest later.
- Extreme negative event at capitulation low, followed by structure flip.
- Extreme positive build into resistance, then unwind and mean reversion.
Also, please check out @NoveltyTrade for the OI Aggregation logic & pulling the data source!
Here is the original script:

Open Interest + Continuation/Discontinuation Patterns📈 Open Interest + Continuation/Discontinuation Patterns
This indicator analyzes Open Interest data to detect four key convergence/divergence patterns that signal potential trend continuation or reversal:
Buyer Continuation
Seller Continuation
Buyer Discontinuation
Seller Discontinuation
Each pattern is identified by comparing price action with Open Interest behavior, using pivot-based logic and ATR filtering for precision. When a valid pattern is detected, the indicator draws visual lines on the chart and triggers custom alert conditions for each type, enabling timely decision-making.
The Open Interest data is plotted as a candle-style oscillator, offering a clear view of momentum shifts. The detection logic is fully configurable, allowing users to adjust pivot sensitivity, lookback ranges, and ATR filters to suit different market conditions.
Key features:
🔍 Detects continuation and discontinuation patterns via convergence/divergence logic
🔔 Alerts for all four pattern types
🕯️ Candle-style visualization of Open Interest
⚙️ ATR-based filtering and pivot customization
Perfect for traders seeking to enhance their market timing using Open Interest dynamics and divergence-based signals.

Open Interest OscillatorIn the middle of a bustling cryptocurrency market, with Bitcoin navigating a critical phase and the community hype over potential ETF approvals, current funding rates, and market leverage, the timing is optimal to harness the capabilities of sophisticated trading tools.
Meet the Open Interest Oscillator – special indicator tailored for the volatile arena of cryptocurrency trading. This powerful instrument is adept at consolidating open interest data from a multitude of exchanges, delivering an in-depth snapshot of market sentiment across all timeframes, be it a 1-minute sprint or a weekly timeframe.
This versatile indicator is compatible with nearly all cryptocurrency pairs, offering an expansive lens through which traders can gauge the market's pulse.
Key Features:
-- Multi-exchange Data Aggregation: This feature taps into the heart of the crypto market by aggregating open interest data from premier exchanges such as BINANCE, BITMEX, BITFINEX, and KRAKEN. It goes a step further by integrating data from various pairs and stablecoins, thus providing traders with a rich, multi-dimensional view of market activities.
-- Open Interest Bars: Witness the flow of market dynamics through bars that depict the volume of positions being opened or closed, offering a clear visual cue of trading behavior. In this mode, If bars are going into negative zone, then traders are closing their positions. If they go into positive territory - leveraged positions are being opened.
-- Bollinger Band Integration: Incorporate a layer of statistical analysis with standard deviation calculations, which frame the open interest changes, giving traders a quantified edge to evaluate the market's volatility and momentum.
-- Oscillator with Customizable Thresholds: Personalize your trading signals by setting thresholds that resonate with your unique trading tactics. This customization brings the power of tailored analytics to your strategic arsenal.
-- Max OI Ceiling Setting: In the fast-paced crypto environment where data can surge to overwhelming levels, the Max OI Ceiling ensures you maintain a clear view by capping the open interest data, thus preserving the readability and interpretability of information, even when market activity reaches feverish heights.
Open Interest OffsetThis indicator is used to display whether there has been an abnormal increase or decrease in recent contract positions. Its usage is similar to the RSI indicator.
Please note that this indicator uses fixed (customizable) thresholds of 0.4 and 0.6 to indicate when abnormal opening and closing occur respectively. For some altcoins, their values may far exceed 0.4 so please adjust accordingly based on your symbol.
(1) When there is an abnormal increase in recent contract positions, the value of the indicator will be above 0.4. This means that there may be a liquidation market situation occurring subsequently. If the market background at this time is rising, it may not be suitable to continue buying because the indicator shows that it is currently overbought. On the contrary, it may be appropriate to sell now.
(2) When there is an abnormal decrease in recent contract positions, the value of the indicator will be below -0.4. This means that a liquidation market situation has occurred recently. If the market background at this time is falling, it may not be suitable to continue shorting because the indicator shows that it is currently oversold. On the contrary, it may be appropriate to buy now.
Special thanks to the following TradingView community members for providing open-source indicators and contributing to the development of this indicator!
Open Interest Delta - By Leviathan - @LeviathanCapital
Regarding the relationship with the above-mentioned open source indicator:
Indicator Open Interest Delta - By Leviathan - @LeviathanCapital obtained OI data for Binance USDT perpetual contracts in the code. We refer to their method of obtaining OI data in our code.
============= 中文版本 =============
该指标用于显示近期合约持仓量是否有异常的增加和减少。它的用法类似于RSI指标
请注意,该指标使用了固定的(可定制的)阈值0.4和0.6来提示异常开仓和平仓的发生。对于某些山寨币而言,指标的数值可能远大于0.4。请根据你所关注的标的自行调整
(1)当近期合约持仓量有异常的增加时,指标的值会在0.4以上。这意味着后续可能有清算行情的发生。若此时市场背景为上涨,此时可能不太适合继续做多,因为指标显示目前处于超买行情。相反,现在可能适合卖出
(2)当近期合约的持仓量有异常的减少时,指标的值会在-0.4以下。这意味着近期已经发生了清算行情。若此时市场背景为下跌,此时可能不太适合继续做空,因为指标显示目前处于超卖行情。相反,现在可能适合买入
特别感谢以下TradingView社区成员提供开源指标并为该指标的开发做出贡献!
Open Interest Delta - By Leviathan - @LeviathanCapital
与上述开源指标的关系:
指标Open Interest Delta - By Leviathan - @LeviathanCapital在代码中获取了Binance USDT永续合约的OI数据。我们在代码中参考他们获取OI数据的方式

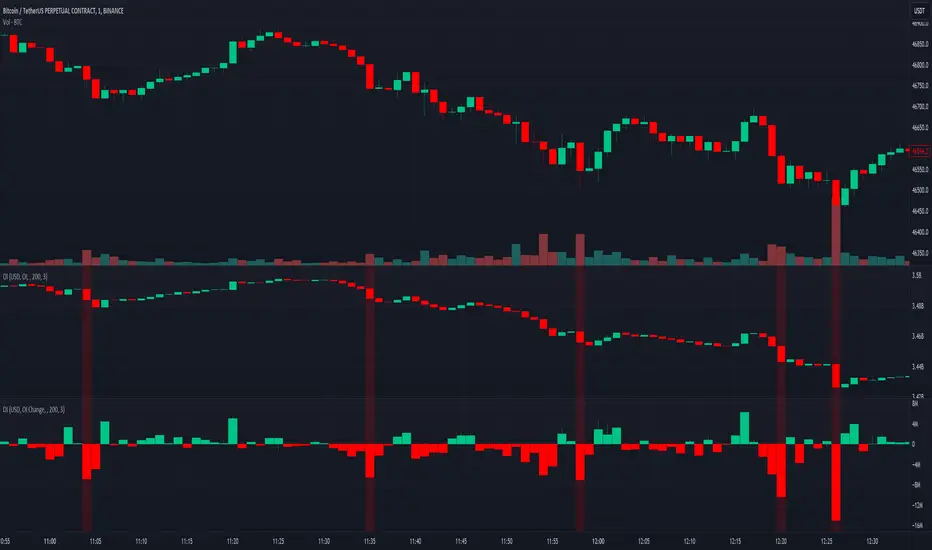
Open Interest Delta - By LeviathanThis script plots Open Interest Delta (change in OI). It also draws a heatmap and colors chart's candles to help you identify bars with large OI increase or decrease and apply Open Interest analysis concepts to your trading.
Positive OI Delta = net increase in open/unsettled positions
Negative OI Delta = net decrease in open/unsettled positions
Open Interest Delta with MAs[Binance Perpetuals]!!!!! This indicator only shows Binance Perpetuals Open Interest Delta !!!!!
!!!!! When Binance Spot pair charts is selected, It still shows the perpetual contract Open Interest, if the pair on the chart is tradeble on perpetual contracts. I assume you know what Open Interest is. !!!!!
ZLEMA , Tillson, VAR MAs codes are coming from @KivancOzbilgic => SuperTrended Moving Averages
KAMA code is coming from @HPOTTER => Kaufman Moving Average Adaptive ( KAMA )

Open Interest with Bollinger Bands and some moving averages!!! This indicator only shows Binance Perpetuals Open Interest !!!
!!!!! When Binance Spot pair charts is selected, It still shows the perpetual contract Open Interest, if the pair on the chart is tradeble on perpetual contracts. I assume you know what Open Interest is. !!!!!
ZLEMA, Tillson, VAR MAs codes are coming from @KivancOzbilgic => SuperTrended Moving Averages

Open Interest-RSI + Funding + Fractal DivergencesIndicator — “Open Interest-RSI + Funding + Fractal Divergences”
A multi-factor oscillator that fuses Open-Interest RSI, real-time Funding-Rate data and price/OI fractal divergences.
It paints BUY/SELL arrows in its own pane and directly on the price chart, helping you spot spots where crowd positioning, leverage costs and price action contradict each other.
1 Purpose
OI-RSI – measures conviction behind position changes instead of price momentum.
Funding Rate – shows who pays to hold positions (longs → bull bias, shorts → bear bias).
Fractal Divergences – detects HH/LL in price that are not confirmed by OI-RSI.
Optional Funding filter – hides signals when funding is already extreme.
Together these elements highlight exhaustion points and potential mean-reversion trades.
2 Inputs
RSI / Divergence
RSI length – default 14.
High-OI level / Low-OI level – default 70 / 30.
Fractal period n – default 2 (swing width).
Fractals to compare – how many past swings to scan, default 3.
Max visible arrows – keeps last 50 BUY/SELL arrows for speed.
Funding Rate
mode – choose FR, Avg Premium, Premium Index, Avg Prem + PI or FR-candle.
Visual scale (×) – multiplies raw funding to fit 0-100 oscillator scale (default 10).
specify symbol – enable only if funding symbol differs from chart.
use lower tf – averages 1-min premiums for smoother intraday view.
show table – tiny two-row widget at chart edge.
Signal Filter
Use Funding filter – ON hides long signals when funding > Buy-threshold and short signals when funding < Sell-threshold.
BUY threshold (%) – default 0.00 (raw %).
SELL threshold (%) – default 0.00 (raw %).
(Enter funding thresholds as raw percentages, e.g. 0.01 = +0.01 %).
3 Visual Outputs
Sub-pane
Aqua OI-RSI curve with 70 / 50 / 30 reference lines.
Funding visualised according to selected mode (green above 0, red below 0, or other).
BUY / SELL arrows at oscillator extremes.
Price chart
Identical BUY / SELL arrows plotted with force_overlay = true above/below candles that formed qualifying fractals.
Optional table
Shows current asset ticker and latest funding value of the chosen mode.
4 Signal Logic (Summary)
Load _OI series and compute RSI.
Retrieve Funding-Rate + Premium Index (optionally from lower TF).
Find fractal swings (n bars left & right).
Check divergence:
Bearish – price HH + OI-RSI LH.
Bullish – price LL + OI-RSI HL.
If Funding-filter enabled, require funding < Buy-thr (long) or > Sell-thr (short).
Plot arrows and trigger two built-in alerts (Bearish OI-RSI divergence, Bullish OI-RSI divergence).
Signals are fixed once the fractal bar closes; they do not repaint afterwards.
5 How to Use
Attach to a liquid perpetual-futures chart (BTC, ETH, major Binance contracts).
If _OI or funding series is missing you’ll see an error.
Choose timeframe:
15 m – 4 h for intraday;
1 D+ for swing trades.
Lower TFs → more signals; raise Fractals to compare or use Funding filter to trim noise.
Trade checklist
Funding positive and rising → longs overcrowded.
Price makes higher high; OI-RSI makes lower high; Funding above Sell-threshold → consider short.
Reverse logic for longs.
Combine with trend filter (EMA ribbon, SuperTrend, etc.) so you fade only when price is stretched.
Automation – set TradingView alerts on the two alertconditions and send to webhooks/bots.
Performance tips
Keep Max visible arrows ≤ 50.
Disable lower-TF premium aggregation if script feels heavy.
6 Limitations
Some symbols lack _OI or funding history → script stops with a console message.
Binance Premium Index begins mid-2020; older dates show na.
Divergences confirm only after n bars (no forward repaint).
7 Changelog
v1.0 – 10 Jun 2025
Initial public release.
Added price-chart arrows via force_overlay.

Open Interest with Heikin Ashi candlesA simple modification of the Tradingview free script of futures Open Interest to Heikin Ashi candles. It displays the volume of the Open Interest futures contracts by applying the HA formula.
I use it to clear out the "noise" of up's and down's especially in intraday small time frames when I am scalping in crypto.
Background color can be turned on/off.
Just to give back a little something to a community that gave me A LOT!
Let me know what you think and if you need anything to add.
Have fun :)
P.S. The way I use it is to try to find traps in the market and take (fast) advantage of them. When the OI are going up really fast in small time frames (which means either longs or shorts are going up) this creates a good opportunity for a squeeze (the trap).
Of course I use other indicators/oscillators to determine that but it gets me on my toes to look for... something ;)

Open Interest StochasticStochastic Money Flow Index(MFI) using open interest instead of volume.
Open Interest data for Binance, Bitmex, and Kraken

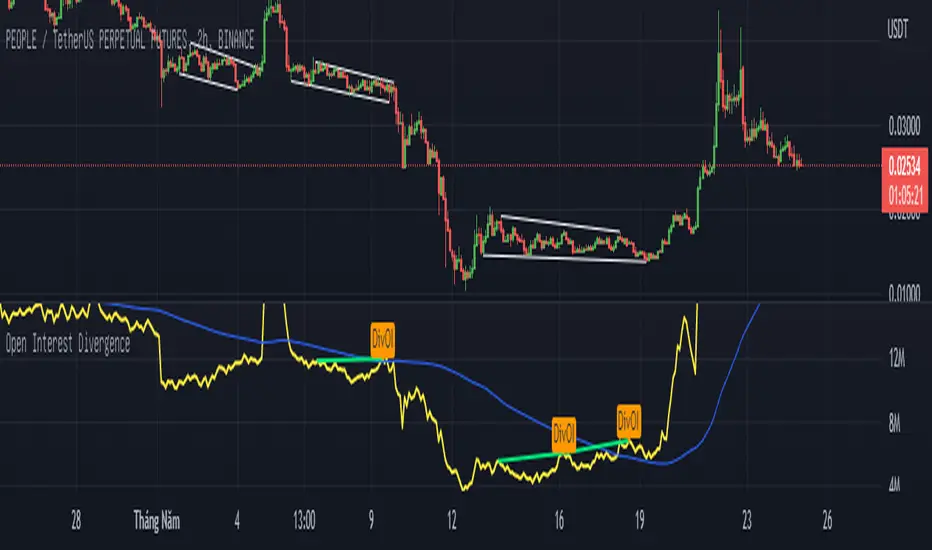
Open Interest Divergence (OI vs Price)This indicator show having increasing Open Interest but price still move in a range (Open Interest Divergence vs price).
It is same with Divergence of indicators as RSI Divergence, Macd Divergence, .... It is easy to understand.
Additional, with MA line OI, you can see the change of OI.
Open InterestSimple indicator that shows the open interest of whatever crypto contract you're looking at in candlestick form.
If it doesn't show anything then Tradingview doesn't have the open interest data for that contract.
At the time of publishing there's data for Binance, Bitmex and Kraken.
You can change the colors in the settings.

Open Interest Stochastic Money Flow IndexThis is the improved version of Stochastic Money Flow Index script that uses Open Interest instead of volume in Future markets.
I think it will make a difference especially in Future and CFD markets.
Since the system will pull data from Quandl, CFTC reports may cause repaint when disclosed.
So if you use it during the weekly time frame (1W), it will definitely not repaint.
You can also use the volume by selecting "Others" from the menu.This option applies to each instrument, you can use it on any financial instrument with or without COT data.
Bitcoin is included in the "Futures" option.
In Futures, you can observe the difference of Open Interest's success by comparing, since it counts exchanges between the two parties singularly, it reacts more firmly to speculative movements.
This script also includes alerts and bar color options, you can use from the menu.
It is also suitable for mutable variables.This script was freed from the integer loads.You can modify it in any adaptive or fractional period.
I hope it will help your analyzes, regards .

Open Interest-Buschi
English:
One part of the "Commitment of Traders-Report" is the Open Interest which is shown in this indicator (source: Quandl database).
The following futures are included:
30-year Bonds (ZB)
10-year Notes (ZN)
Soybeans (ZS)
Soybean Meal (ZM)
Soybean Oil (ZL)
Corn (ZC)
Soft Red Winter Wheat (ZW)
Hard Red Winter Wheat(KE)
Lean Hogs (HE)
Live Cattle (LE)
Gold (GC)
Silver (SI)
Copper (HG)
Crude Oil (CL)
Heating Oil (HO)
RBOB Gasoline (RB)
Natural Gas (NG)
Australian Dollar (A6)
British Pound (B6)
Canadian Dollar (D6)
Euro (E6)
Japanese Yen (J6)
Swiss Franc (S6)
Sugar (SB)
Coffee (KC)
Cocoa (CC)
Cotton (CT)
S&P 500 E-Mini (ES)
Russell 2000 E-Mini (RTY)
Dow Jones Industrial Mini (YM)
Nasdaq 100 E-Mini (NQ)
Platin (PL)
Palladium (PA)
Aluminium (AUP)
Steel (HRC)
Ethanol (AEZ)
Brent Crude Oil (J26)
Rice (ZR)
Oat (ZO)
Milk (DL)
Orange Juice (JO)
Lumber (LS)
Feeder Cattle (GF)
S&P 500 (SP)
Dow Jones Industrial Average Index (DJIA)
New Zealand Dollar (N6)
Deutsch:
Ein Bestandteil des "Commitment of Traders-Report" ist das Open Interest, das in diesem Indikator dargestellt wird (Quelle: Quandl Datenbank).
Folgende Futures sind enthalten:
30-jährige US-Staatsanleihen (ZB)
10-jährige US-Staatsanleihen (ZN)
Sojabohnen(ZS)
Sojabohnen-Mehl (ZM)
Sojabohnen-Öl (ZL)
Mais(ZC)
Soft Red Winter-Weizen (ZW)
Hard Red Winter-Weizen (KE)
Magerschweine (HE)
Lebendrinder (LE)
Gold (GC)
Silber (SI)
Kupfer(HG)
Rohöl (CL)
Heizöl (HO)
Benzin (RB)
Erdgas (NG)
Australischer Dollar (A6)
Britisches Pfund (B6)
Kanadischer Dollar (D6)
Euro (E6)
Japanischer Yen (J6)
Schweizer Franken (S6)
Zucker (SB)
Kaffee (KC)
Kakao (CC)
Baumwolle (CT)
S&P 500 E-Mini (ES)
Russell 2000 E-Mini (RTY)
Dow Jones Industrial Mini (YM)
Nasdaq 100 E-Mini (NQ)
Platin (PL)
Palladium (PA)
Aluminium (AUP)
Stahl (HRC)
Ethanol (AEZ)
Brent Rohöl (J26)
Reis (ZR)
Hafer (ZO)
Milch (DL)
Orangensaft (JO)
Holz (LS)
Mastrinder (GF)
S&P 500 (SP)
Dow Jones Industrial Average Index (DJIA)
Neuseeland Dollar (N6)

Open Interest Screener (Fixed Zones)📌 Purpose
This indicator scans Open Interest (OI) changes across selected exchanges and highlights significant spikes or drops directly on the chart using dynamic shaded zones.
It is designed to help traders detect unusual market positioning changes that may precede volatility events.
🧠 How It Works
1. Data Sources
Supports multiple exchanges: BitMEX USD, BitMEX USDT, Kraken USD (toggle on/off in settings).
Automatically adapts symbol prefix based on the chart’s base asset.
2. Spike / Drop Detection
OI % Change is calculated over a configurable lookback (Bars to look back).
Spike Up: OI increases by more than Threshold %.
Spike Down: OI decreases by more than Threshold %.
3. Dynamic Zones
When a spike occurs, a green zone (increase) or red zone (decrease) is drawn on the chart.
Zone height is dynamic, based on price high/low ± 5%, preventing chart distortion.
Minimum spacing (Zone Spacing) prevents clustering.
📈 How to Use
Green Zones: Large OI increase can signal fresh positioning (possible breakout setups).
Red Zones: Large OI decrease can signal liquidation events or position unwinds.
Combine with price action, funding rates, or volatility measures for higher confidence.
Recommended Timeframes: Works best on 15m, 1h, 4h.
Markets: Crypto derivatives (OI data available).
⚙️ Inputs
Bars to Look Back
OI % Change Threshold
Zone Width
Exchange toggles (BitMEX USD/USDT, Kraken USD)
⚠️ Disclaimer
This script is for educational purposes only and does not constitute financial advice.
Always test thoroughly before live trading.

COT (Legacy): Open InterestOpen Interest from legacy commitment of traders (COT) report. For the main symbol but also allows to override it. Also allows to include options in consideration.
Aggregated Open Interest [Alpha Extract]The Aggregated Open Interest indicator provides a comprehensive view of open interest across multiple cryptocurrency exchanges, allowing traders to monitor institutional positioning and market sentiment. By aggregating data from major exchanges like Binance, BitMEX, and Kraken, this indicator offers valuable insights into potential price movements and market shifts.
🔶 CALCULATION
The indicator processes open interest data through multiple analytical methods:
Exchange Aggregation: Collects and normalizes open interest data from multiple exchanges (Binance, BitMEX, Kraken) with proper currency normalization.
Multi-Mode Analysis: Calculates various metrics including raw open interest values, OI change, OI delta, volume-weighted delta, and OI RSI.
Divergence Detection: Uses pivot point analysis to identify divergences between price action and open interest movements.
Activity Assessment: Tracks bullish and bearish activity patterns by correlating open interest changes with price movements.
Formula:
Aggregate OI = Sum of normalized open interest from selected exchanges
OI Change = Current OI - Previous OI
OI Delta = Net change in open interest across timeframes
OI Delta × Volume = OI Delta weighted by relative volume
OI RSI = Relative Strength Index applied to open interest values
OI Heatmap = Multi-timeframe visualization of OI changes across 7 distinct periods
🔶 DETAILS
Visual Features:
Open Interest: Candlestick representation of aggregated open interest
OI Change: Histogram showing period-to-period changes
OI Delta: Histogram displaying net OI movements
OI Delta × Volume: Volume-weighted OI delta for enhanced signals
OI RSI: Oscillator showing overbought/oversold OI conditions
OI Heatmap: Multi-timeframe visualization showing OI changes across 7 periods (3, 5, 8, 13, 21, 34, and 55 days)
Divergence Detection: Color-coded markers (teal for bullish, red for bearish) highlighting significant divergences between price and open interest
Analysis Table: Real-time summary of key metrics including aggregate OI, recent changes, and bullish/bearish activity.
Interpretation:
Increasing Open Interest + Rising Price: Strong bullish trend confirmation
Increasing Open Interest + Falling Price: Strong bearish trend confirmation
Decreasing Open Interest + Rising Price: Weak bullish trend (potential reversal)
Decreasing Open Interest + Falling Price: Weak bearish trend (potential reversal)
Divergences: Signal potential trend exhaustion and reversals when price moves in one direction while open interest moves in the opposite direction
Heatmap: Provides at-a-glance insight into open interest trends across multiple timeframes, with green bars indicating rising OI and red bars indicating falling OI
🔶 EXAMPLES
Trend Confirmation: Rising open interest accompanying a price increase confirms strong bullish momentum with institutional backing.
Example: During January-February 2025, rising OI during price advances confirms institutional participation in the uptrend.
Bearish Divergence: Price makes a higher high while open interest makes a lower high, signaling potential trend reversal.
Example: Red markers appear at market tops where price continues higher but open interest fails to confirm, preceding significant corrections.
Bullish Divergence : Price makes a lower low while open interest makes a higher low, indicating potential bottoming.
Example: Teal markers appear at market bottoms where price continues lower but open interest fails to confirm, preceding significant rallies.
OI Heatmap Analysis : Multiple timeframes showing consistent red signals across short to long-term periods indicate strong institutional selling pressure.
Example: When all 7 periods (3-55 days) show red during a price uptrend, this signals institutional selling into retail strength, often preceding major corrections.
🔶 SETTINGS
Customization Options:
Data Sources: Toggle different exchanges (Binance USDT/USD/BUSD, BitMEX USD/USDT, Kraken USD)
Display Mode: Choose between Open Interest, OI Change, OI Delta, OI Delta × Volume, OI RSI, and OI Heatmap
Currency Units: Display in USD or base cryptocurrency (COIN)
Analysis Tools: Moving Average (length and color), RSI (length and color)
Divergence Detection: Enable/disable signals, adjust lookback period and threshold percentage, customize bullish/bearish divergence colors
OI Heatmap Colors: Customize bullish (green) and bearish (red) signal colors for the multi-timeframe heatmap visualization
The Aggregated Open Interest indicator provides traders with comprehensive insights into institutional positioning across major exchanges, helping identify potential trend continuations, reversals, and key market turning points driven by smart money movements. The addition of the OI Heatmap feature enables traders to quickly visualize open interest trends across multiple timeframes, providing valuable context for institutional positioning over different market cycles.

Weiss Wave Open Interest BarsFirstly :
LazyBear ' s "Weiss Wave " codes are used for open interests.
Original Weiss Wave Volume :
Let's start :
Open Interest vs. Volume: An Overview
Volume and open interest are two key measurements that describe the liquidity and activity of contracts In the options and futures markets. However, their meanings and applications are different. Volume refers to the number of contracts traded in a given period, while open interest denotes the number of active contracts.
Volume
Trading volume measures the number of options or futures contracts being exchanged between buyers and sellers, identifying the level of activity for that particular contract. For every buyer, there is a seller, and the transaction itself counts toward the daily volume.
Open Interest
Open interest indicates the number of options or futures contracts that are held by traders and investors in active positions. These positions have not been closed out, expired, or exercised. Open interest decreases when holders and writers of options (or buyers and sellers of futures) close out their positions. To close out positions, they must take offsetting positions or exercise their options. Open interest increases once again when investors and traders open new long positions or writers/sellers take on new short positions. Open interest also increases when new options or futures contracts are created.
Options or futures contract trading volume can only increase while open interest can either increase or decrease. While trading volume indicates the number of contracts that have been bought or sold, open interest identifies the number of contracts that are currently held.
Reference : www.investopedia.com
*** Worked to define all futures . You can look them in codes (between line : 13 to line 94 )
** CAUTION 1 : Since each instrument in the list has its own unique contract data, you must first enter its name to display it. I recommend you to select OANDA from the markets. Finally, when the COT reports are issued, it may repaints. However, this repaint is usually close to closing or after close .(When COT reports are so sharp ) So use this script only 1W ( 1 week ) or 1 M ( 1 month ) timeframe.
** CAUTION 2 : This data is taken to Tradingview with the help of Quandl. This is a tremendous possibility, but the system will not work if there is a malfunction.
Best regards.

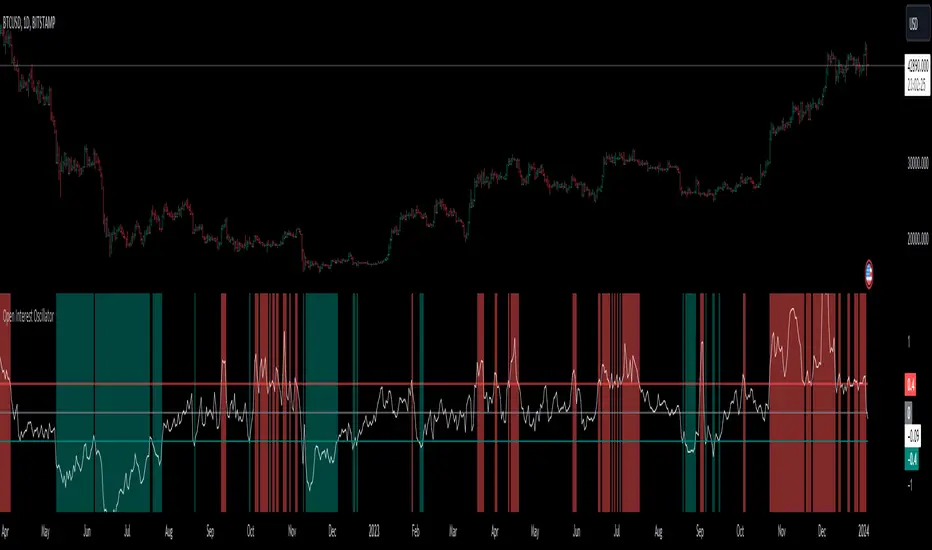
Normalized Open InterestNormalized Open Interest (nOI) — Indicator Overview
What it does
Normalized Open Interest (nOI) transforms raw futures open-interest data into a 0-to-100 oscillator, so you can see at a glance whether participation is unusually high or low—similar in spirit to an RSI but applied to open interest. The script positions today’s OI inside a rolling high–low range and paints it with contextual colours.
Core logic
Data source – Loads the built-in “_OI” symbol that TradingView provides for the current market.
Rolling range – Looks back a user-defined number of bars (default 500) to find the highest and lowest OI in that window.
Normalization – Calculates
nOI = (OI – lowest) / (highest – lowest) × 100
so 0 equals the minimum of the window and 100 equals the maximum.
Visual cues – Plots the oscillator plus fixed horizontal levels at 70 % and 30 % (or your own numbers). The line turns teal above the upper level, red below the lower, and neutral grey in between.
User inputs
Window Length (bars) – How many candles the indicator scans for the high–low range; larger numbers smooth the curve, smaller numbers make it more reactive.
Upper Threshold (%) – Default 70. Anything above this marks potentially crowded or overheated interest.
Lower Threshold (%) – Default 30. Anything below this marks low or capitulating interest.
Practical uses
Spot extremes – Values above the upper line can warn that the long side is crowded; values below the lower line suggest disinterest or short-side crowding.
Confirm breakouts – A price breakout backed by a sharp rise in nOI signals genuine engagement.
Look for divergences – If price makes a new high but nOI does not, participation might be fading.
Combine with volume or RSI – Layer nOI with other studies to filter false signals.
Tips
On intraday charts for non-crypto symbols the script automatically fetches daily OI data to avoid gaps.
Adjust the thresholds to 80/20 or 60/40 to fit your market and risk preferences.
Alerts, shading, or additional signal logic can be added easily because the oscillator is already normalised.
